What Is Traffic Benchmarking? A Practical 2026 Guide
TL;DR: Traffic benchmarking is the process of measuring your website's current performance against a baseline (your own historical data) to track growth and diagnose drops. You cannot benchmark against competitors directly—use industry averages and your own trends. Focus on quality metrics like engagement, not just vanity traffic. This article provides a simple 4-step workflow, a mistake-prevention checklist, and practical advice for different site types.
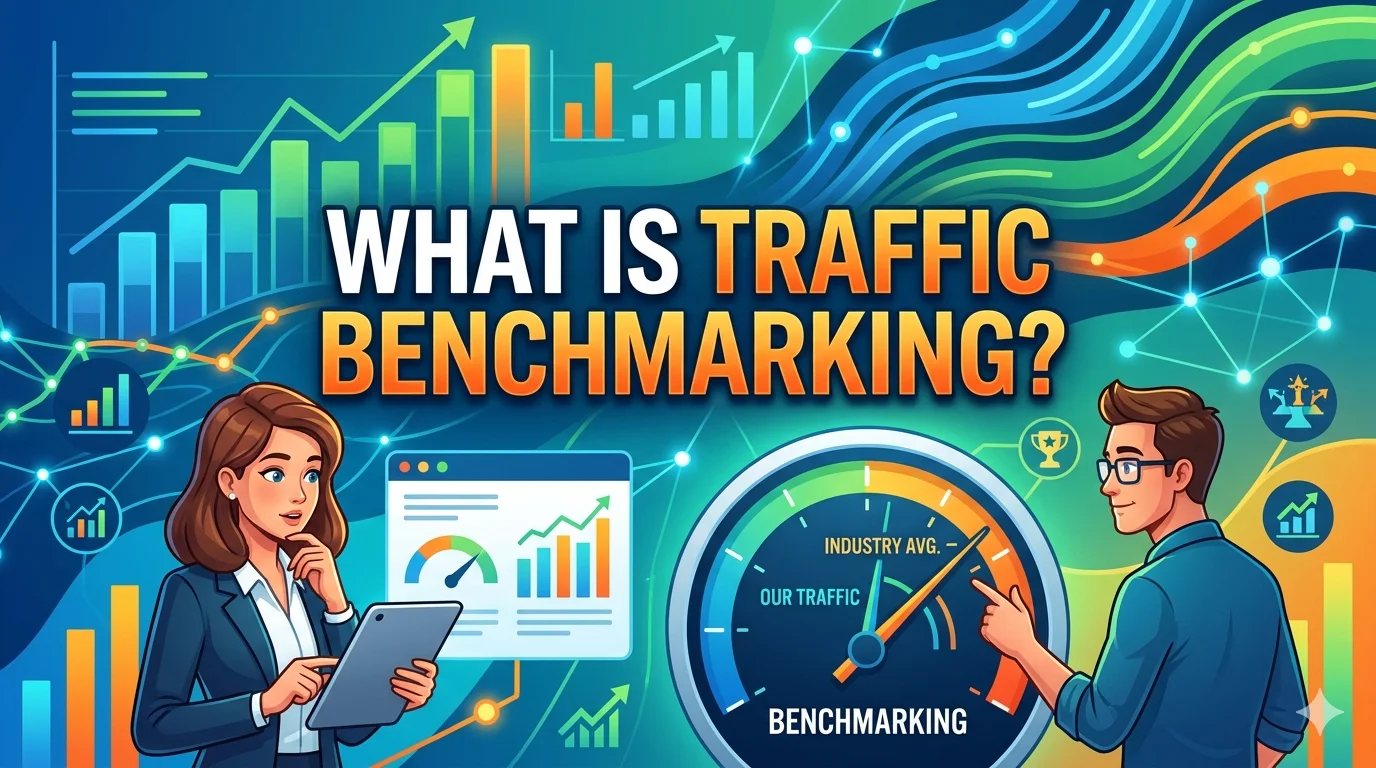
Quick Answer: Traffic benchmarking is comparing your website’s key metrics—sessions, pageviews, conversion rates—against a defined standard, usually your own past performance or a relevant industry average. It helps you set realistic goals, identify issues early, and prove the value of your SEO efforts. You do this using tools like Google Analytics, Google Search Console, and dedicated SEO platforms.
Key Takeaways
- Always use your own historical data as the primary benchmark; external averages are secondary references.
- Segment your traffic by source (organic, direct, referral, social) to see where changes are happening.
- Benchmarking frequency should match your site's traffic volume: weekly for high-traffic, monthly for medium, quarterly for low.
- Focus on leading indicators (click-through rate, dwell time) alongside lagging indicators (sessions, pageviews).
- Use the “SMARTCHAINE Checkpoint” framework: Scope, Match, Analyze, React, Track, Halt, Investigate, Navigate, Evaluate.
- Avoid the mistake of comparing your site to an industry leader without accounting for domain age, authority, or budget.
Table of Contents
What Is Traffic Benchmarking?
Traffic benchmarking is the practice of establishing a performance baseline for your website’s traffic metrics so you can measure progress, diagnose problems, and make informed decisions. It is not about vanity numbers. The core idea is simple: you cannot improve what you do not measure. By setting a benchmark, you move from guessing to knowing whether your SEO work is working or failing.
The Difference Between Benchmarking and Reporting
Reporting tells you what happened. Benchmarking tells you what should have happened. A report shows you had 10,000 sessions last month. A benchmark shows you that your 12-week rolling average is 9,500 sessions, so 10,000 is a positive signal. Without a benchmark, a single data point is meaningless.
Expert Tip: When setting your first benchmark, use a minimum of 12 weeks of historical data. Anything less is prone to seasonal noise. If you have less than 12 weeks, label your benchmark as “preliminary” and update it quarterly.
What to Benchmark (Beyond Sessions)
While total sessions and pageviews are common, they are not the most useful metrics. Prioritize these instead:
- Organic sessions: The most direct measure of SEO effectiveness.
- Average engagement time: A metric aligned with Google’s focus on user experience.
- Bounce rate (adjusted): For informational content, a high bounce rate can be normal. For transactional pages, it should be low.
- Goal completions: Form fills, product purchases, or newsletter sign-ups.
- Click-through rate (CTR) from search: A leading indicator of title tag and snippet effectiveness.
Why Benchmarking Matters in 2026
In 2026, the search landscape includes AI Overviews, multi-source answer boxes, and evolving user expectations. These changes make traffic patterns less predictable. A benchmark gives you a stable reference point when volatility increases. Without it, you cannot tell if a traffic drop is a Google algorithm issue, a seasonal trend, or a problem with your own content.
Key Context: AI Overviews can reduce click-through rates for some queries while increasing visibility for others. If you benchmark only total traffic, you might miss a shift in how users interact with your brand. Segment by search appearance (with and without AI Overviews) using Search Console filters.
The 4-Step Benchmarking Workflow
Use the “SMARTCHAINE Checkpoint” framework to build your benchmarking process. It is not a formula—it is a decision-making workflow that adapts to your site size and resources.
Step 1: Scope Your Baseline
What it is: Decide what you are measuring. Do not measure everything. Pick 3 to 5 core metrics that align with your business goals.
How to do it: Open Google Analytics and create a custom date range of the last 12 weeks. Note your average, median, and lowest/highest weekly values for each metric. Use the median as your primary benchmark because it resists outlier spikes (like a viral post or a server crash).
Step 2: Match to Segments
What it is: Break your baseline into traffic sources, device types, and landing page groups. A benchmark for “organic traffic to blog posts” is more useful than a site-wide average.
How to do it: In Google Analytics, use the Source/Medium dimension. Create a segment for “google / organic” and compare it to “direct / none” and “bing / organic” separately. You will often find that one source is growing while another is declining—the aggregate number hides this.
Step 3: Analyze the Gap
What it is: Compare your current period (this week or month) against your baseline. Calculate the percentage difference. Focus on gaps larger than your typical weekly variation (also called your “noise floor”).
How to do it: If your median weekly organic sessions are 5,000 and your weekly variation is ±10%, then any change below 10% should not trigger a reaction. If a week drops 25%, that is actionable.
Step 4: React, Track, and Halt
What it is: Based on the gap analysis, decide what to do. Not every drop needs a fix. Some are temporary.
How to do it: Create three action zones:
- Green zone: Gap within normal variation. No action needed. Observe.
- Yellow zone: Gap 20-30% below baseline for two consecutive periods. Investigate content quality, Search Console impressions, and technical errors.
- Red zone: Gap 30%+ below baseline. Halt all non-critical publishing. Audit Core Web Vitals, crawl errors, and manual actions. Check Search Console for index coverage issues.
Common Mistakes to Avoid
Mistake 1: Comparing Your Site to a Competitor’s Traffic
You cannot see a competitor’s real Google Analytics data. Tools like Similarweb or Ahrefs provide estimates, not actuals. These estimates can be off by 50% or more. Use competitor data only to identify content gaps, not as a performance target.
Mistake 2: Using Average Instead of Median
An average is easily skewed by one high-traffic day. If you post a viral piece, your average for the week jumps, making the next week look like a failure even if it was normal. Use median for your baseline.
Mistake 3: Ignoring Seasonality
Ecommerce sites see massive spikes in November and December. A content site might drop in summer. You must benchmark year-over-year for the same time period, not month-over-month. A January drop compared to December is not a decline—it is normal.
Mistake 4: Benchmarking Without Business Context
More traffic is not always better. If your traffic increases but conversions drop, your targeting is off. Always pair traffic benchmarks with conversion or engagement metrics. Use a table to compare the two:
| Scenario | Traffic Change | Engagement Change | Action |
|---|---|---|---|
| Traffic up, engagement up | +20% | +15% | Keep doing what you are doing. Scale successful content. |
| Traffic up, engagement down | +30% | -10% | Check if traffic source changed. Low-quality backlinks or irrelevant keywords might be the cause. |
| Traffic down, engagement up | -15% | +20% | You have lost some volume but gained quality. The remaining audience is more engaged. Review what changed in your targeting. |
| Traffic down, engagement down | -25% | -18% | Investigate technical issues, algorithm changes, or content quality drops. |
How This Applies in Practice
For a Beginner Website
You have under 500 sessions per month. Do not set weekly benchmarks. Set a monthly benchmark using the median of the last 4 months. Focus on one metric: organic sessions from Google. Ignore everything else until you reach 1,000 organic sessions per month. Your primary action should be publishing more content and checking that pages are indexed via Google Search Console.
For a SaaS Website
Your focus is on trial sign-ups and demo requests, not pageviews. Benchmarks should center on conversion rate from blog traffic to sign-up. Set a baseline for each high-intent landing page. Use UTM parameters to track which blog post drives the most conversions. If a page gets lots of traffic but zero conversions, it needs a better CTA or more relevant content. Avoid benchmarking blog traffic alone—it can be high but unproductive.
For an Ecommerce Store
Benchmark by product category, not site-wide. Your “summer shoes” category has a different benchmark than “winter coats.” Use year-over-year comparison for the same week, because seasonal variance is huge. Add a secondary benchmark for page load time (Core Web Vitals) because a slow page directly reduces conversion rate. If traffic is steady but revenue drops, check your Largest Contentful Paint (LCP) benchmark against the recommended threshold of 2.5 seconds.
For a Local Business
Your traffic is primarily from local searches and Google Business Profile (GBP) impressions. Benchmark your GBP profile views, direction requests, and phone call clicks—not just website sessions. Your website benchmark should be based on queries including “near me” or your city name. If website traffic is growing but GBP actions are flat, you have a local search visibility problem. Work on local citations and GBP post frequency.
Frequently Asked Questions
How often should I run a traffic benchmark?
Frequency depends on your traffic volume. For sites with over 10,000 sessions per week, a weekly benchmark is useful because you have enough data to smooth out noise. For sites with 1,000 to 10,000 sessions per week, a bi-weekly review is sufficient. For smaller sites (under 1,000 sessions weekly), run benchmarks monthly. The key is consistency—always use the same time window and the same metrics. Running benchmarks more often than your data allows will lead to false positives. Create a recurring calendar reminder to pull the data from Google Analytics or Search Console at the same time each period.
Can I benchmark against industry averages?
You can, but treat them as directional only. Industry benchmarks from tools like Semrush, Ahrefs, or Moz are based on aggregated data from their user bases. These averages can be useful for setting rough expectations—for example, an average organic CTR for a top-3 position is around 30-40% for informational queries. However, your specific niche, content quality, and site authority will shift these numbers significantly. The real benchmark tool is your own search performance data in Google Search Console. Use industry numbers as a sanity check, not a target.
What is the difference between a baseline and a benchmark?
A baseline is your starting point—the raw measurement of your current performance at a specific time. A benchmark is the standard you compare against, which can be your baseline or an external reference. Think of it like a race: the baseline is your starting position, and the benchmark is the time you aim to beat. In practice, you calculate your baseline (e.g., median weekly organic traffic over 12 weeks) and then use that baseline as your benchmark going forward. When your traffic changes, you compare it to that established benchmark, not to a new baseline.
How do I handle AI Overviews in my benchmarking?
AI Overviews can reduce traditional click-through rates for informational queries, but they can also increase brand visibility. To handle this, segment your Search Console data by search appearance. Look for the “AI Overviews” filter (or a similar label) in the performance report. Compare your CTR and impressions for queries that trigger AI Overviews versus those that do not. If you see a drop in CTR for a query that now triggers an AI Overview, that is expected. Your benchmark should track “brand mentions within AI Overviews” separately and adjust your traffic expectations downward for those queries by 30-50%.
What tools do I need for traffic benchmarking?
Three free tools are essential: Google Analytics for traffic volume and user behavior, Google Search Console for search performance and indexing status, and a spreadsheet (Google Sheets or Excel) to store and visualize your benchmarks. For more advanced needs, paid tools like Semrush or Ahrefs can provide competitive positioning data and historical trends. However, do not pay for a tool just for benchmarking. The free tools cover 90% of what you need. Set up a simple dashboard in Google Looker Studio (formerly Data Studio) to automatically plot your weekly metrics against your baseline median.
Article Summary
You learned that traffic benchmarking is about setting a reliable baseline using your own historical data, not comparing to unknown competitors. The SMARTCHAINE Checkpoint framework helped you build a 4-step process: Scope your baseline, Match to segments, Analyze the gap, and React with defined zones. You saw how to apply this differently for beginner sites, SaaS, ecommerce, and local businesses. The key is consistency in measurement, using median over average, and pairing traffic data with engagement or conversion metrics. Avoid the common mistakes of ignoring seasonality and reacting to normal traffic noise.
Conclusion
Traffic benchmarking is not a one-time setup. It is a recurring practice that keeps your SEO efforts grounded in reality. The goal is not to chase arbitrary numbers, but to understand your site’s normal rhythm so you can act decisively when things change. Start small this week: open Google Analytics, set a 12-week date range, find the median for organic sessions, and write it down. That single number is your first benchmark. Build from there.
Recommended Resources
- Google Search Central – Official documentation on indexing, crawling, and search performance.
- Google Search Console – Free tool for monitoring search traffic, index status, and site issues.
- Google Analytics – Essential for setting traffic baselines and tracking user behavior.
- Ahrefs Blog – Practical SEO guides and competitive analysis tutorials.
- Semrush Blog – Digital marketing insights and traffic strategy advice.
- Moz Blog – Beginner-friendly SEO resources and algorithm updates.
About the Author
The SMARTCHAINE Editorial Team specializes in SEO, AI Search Optimization, GEO (Generative Engine Optimization), AI Overviews, Structured Data, Technical SEO, and search visibility strategies for modern search engines and AI-powered discovery platforms.